

What Does Absorption At Key Levels Look Like?
Orderflow Student

What Is Absorption in Trading? (And Why It Matters)
Alright, let’s talk about absorption. No, not the kind where you soak up spilled coffee with a paper towel—this is about how the market soaks up big buy or sell orders without the price going crazy. It’s one of those behind-the-scenes things that happens all the time in trading, and once you understand it, you’ll start seeing the market in a whole new way.
Imagine This Scenario:
You’re at a farmers’ market, and there’s a stall selling the most amazing apples. Everyone wants them, but the stall only has a limited supply. Now, imagine two different situations:
The Stall Runs Out of Apples: If a bunch of people show up all at once and buy every single apple, the stall owner might think, “Wow, these apples are in high demand! I’ll raise the price tomorrow.” The price goes up because the supply couldn’t handle the demand.
The Stall Has a Secret Stockpile: But what if the stall owner has a hidden stash of apples in the back? When the crowd shows up, they keep pulling out more apples to sell, and the price stays the same because there’s enough supply to meet the demand. The crowd’s buying pressure gets absorbed by the stall owner’s stockpile.
In trading, absorption is like that secret stockpile. It’s what happens when there’s enough liquidity (buyers or sellers) to “soak up” a big order without the price moving much.
How This Plays Out in the Markets:
Let’s say a big institutional trader wants to buy 10,000 shares of a stock. If they just dumped that order into the market all at once, it could cause the price to spike because there aren’t enough sellers at the current price to match the order. But instead, they might break it up into smaller chunks or work with a market maker to execute the trade slowly.
Here’s the key: If there are enough sellers willing to sell at or near the current price, the big buy order gets absorbed without causing a huge price move. The market stays stable because the supply (sellers) meets the demand (buyers).
Why Should You Care About Absorption?
Because it tells you a lot about what’s really going on in the market. Here’s how:
Spotting Big Players: When you see a lot of volume but the price isn’t moving much, it’s often a sign that big players (like institutions or market makers) are absorbing the orders. They’re the ones with the “secret stockpile” of liquidity.
Finding Key Levels: Absorption often happens at specific price levels—like support or resistance. If the price keeps bouncing off a certain level, it’s because buyers or sellers are stepping in to absorb the orders there. These levels can become important zones to watch for future trades.
Reading the Market’s Mood: If the market keeps absorbing big sell orders without dropping, it’s a sign that there’s strong underlying demand (bullish). On the flip side, if big buy orders can’t push the price higher, it might mean there’s hidden selling pressure (bearish).
A Real-Life Example:
Let’s say Bitcoin is trading at $100,000, and a whale (a big trader) wants to sell a ton of BTC. If the market absorbs that sell order without the price dropping much, it’s a sign that there are enough buyers willing to step in and buy at that level. That’s absorption in action. But if the price tanks, it means the sellers overwhelmed the buyers, and the market couldn’t absorb the order.
How to Use This in Your Trading:
Watch for Absorption Zones: These are areas where the price has stalled or reversed in the past. If you see a lot of volume but the price isn’t moving, it’s likely absorption at work.
Gauge Market Strength: If the market keeps absorbing big orders without moving, it’s a sign of strength (if it’s absorbing sells) or weakness (if it’s absorbing buys).
Trade with the Big Players: If you see absorption happening, it’s often a clue that the big players are active. You can use that information to align your trades with their flow.
The Bottom Line:
Absorption is like the market’s way of saying, “I’ve got this.” It’s what keeps prices stable when big orders come in, and it’s a powerful clue about where the market might be headed next. Once you start noticing it, you’ll see it everywhere—and it can totally change how you trade.
Trading the 6112/15 Level on the ES: Why I Went Long
Yesterday, I was watching the 6112/15 level on the ES like a hawk. This zone wasn’t just another random number on the chart—it was a key area where buyers were stepping in to absorb selling pressure. And that’s exactly why I decided to go long there. Let me break it down for you.
What Made 6112/15 Special?
This level had all the hallmarks of a strong absorption zone. Here’s what I saw:
Buyers Stepping In: Every time the ES dipped toward 6112/15, buyers showed up to defend the level. It was like a magnet—price would touch the zone, and boom, buying volume would spike, pushing the price back up.
Sellers Getting Absorbed: Even when sellers tried to push the price lower, their orders were getting soaked up by the buyers. The price would stall or reverse, signaling that the sellers didn’t have enough strength to break through.
A Clear Support Zone: After multiple tests, it was clear that 6112/15 was acting as a strong support level. The more times a level holds, the more significant it becomes.
Why I Went Long at 6112/15
When I saw the ES approach this level yesterday, I had a few reasons to believe it was a good long setup:
Absorption = Strength: The fact that buyers were consistently absorbing selling pressure at this level told me there was strong demand here. It wasn’t just a random bounce—it was a clear signal that buyers were in control.
Risk-Reward Was Favorable: With a clear support zone at 6112/15, I could place a tight stop-loss just below the level (maybe around 6110). If I was wrong, I’d lose very little. But if I was right, the upside potential was solid, especially if the ES broke out of its recent range.
Market Context: The broader market sentiment was also supportive. If the ES was holding key levels like 6112/15, it suggested that buyers were still in the game and looking for opportunities to push higher.
What Happened Next?
After entering the long trade, I watched closely to see how the market would react. Here’s what I was looking for:
Confirmation: If the price held above 6112/15 and started to move higher, it would confirm that the absorption was working and buyers were in control.
Breakout Potential: If the ES could break through the next resistance level (let’s say 6125), it could open the door for a bigger move up.
Exit Plan: If the price broke below 6112/15 and my stop-loss was hit, I’d know that the absorption had failed and sellers were taking over.
Visual Example: Absorption at 6112/15
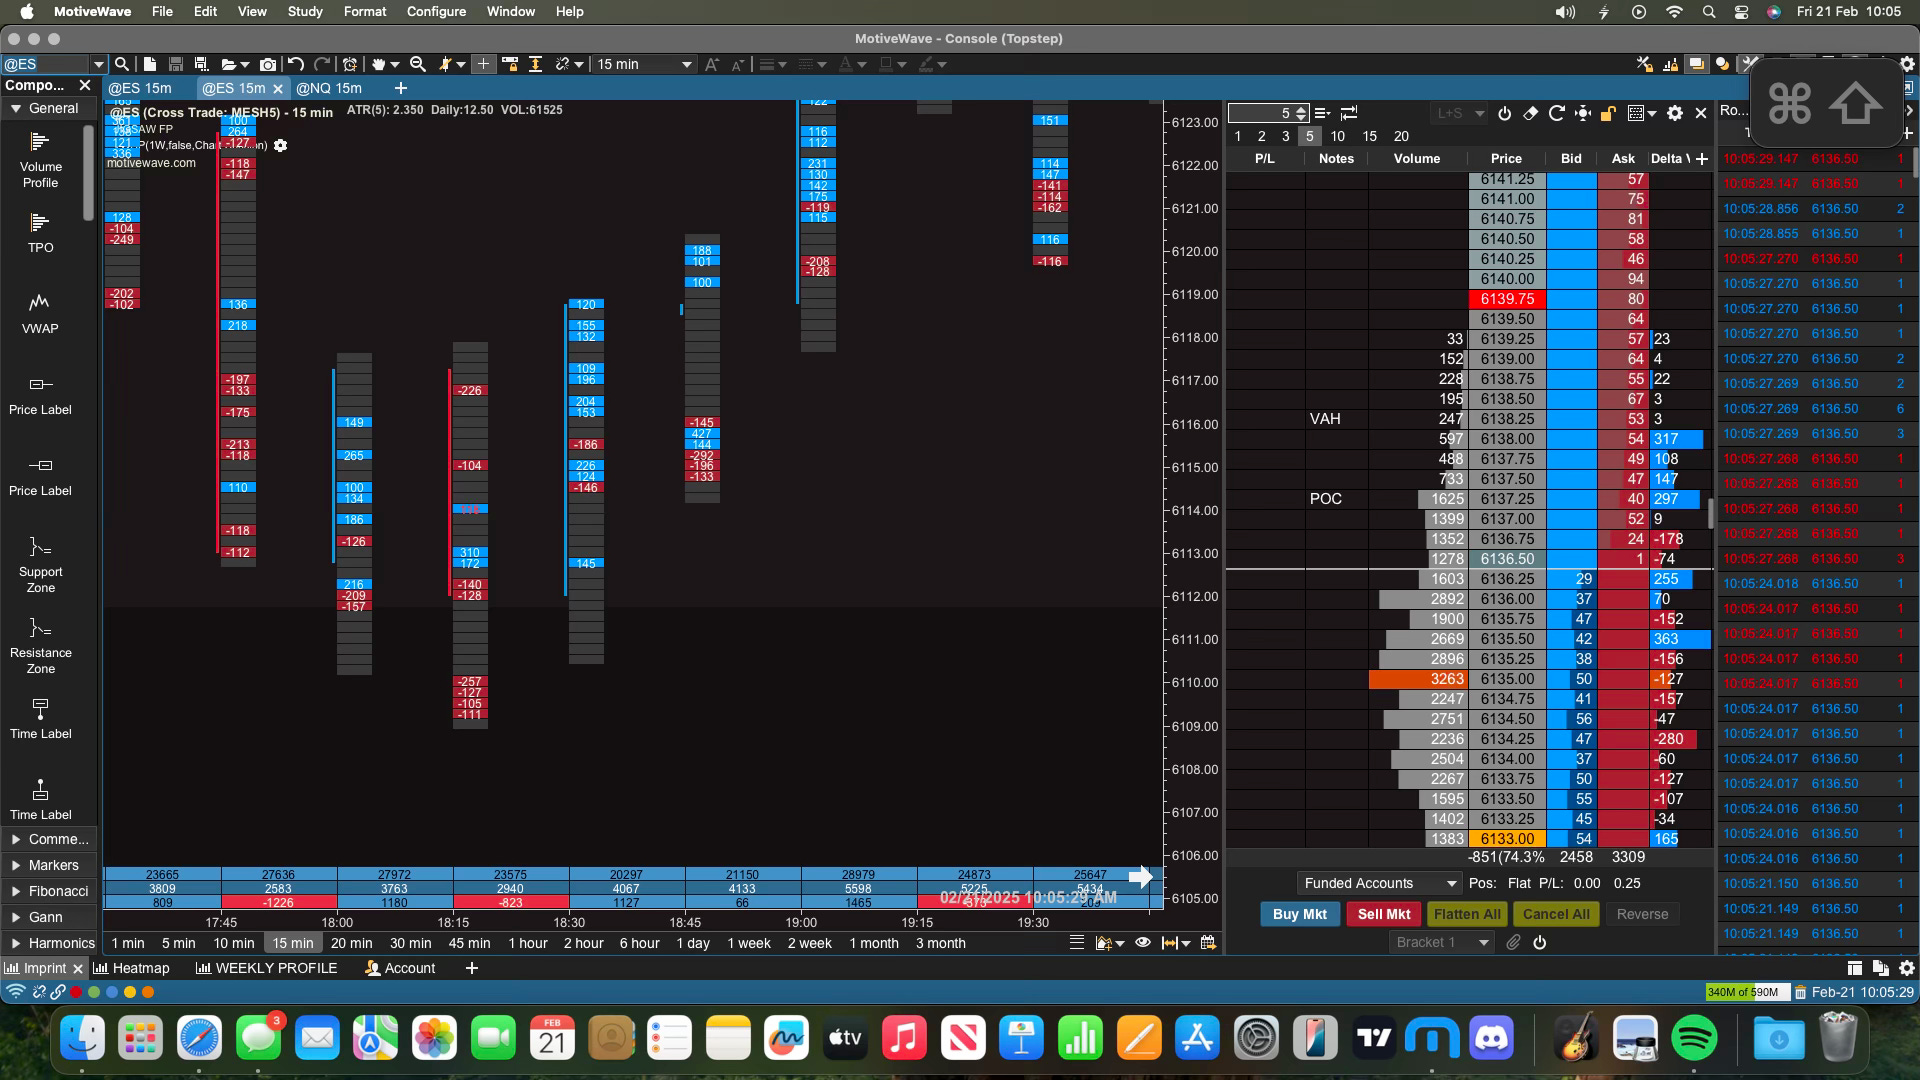
Price Action: Show the ES approaching 6112/15 multiple times and bouncing.
Volume Spikes: Highlight the moments where buying volume spiked as the price hit the zone.
Absorption Zone: Draw a box around 6112/15 to emphasize the area where buyers were stepping in.
The Bigger Lesson
This trade was a great example of how to use absorption to your advantage. When you see a level where buyers (or sellers) are consistently stepping in to absorb orders, it’s a strong signal that the market is defending that level. And if you can get in early, like I did at 6112/15, you can ride the move as the absorption plays out.
Key Takeaways for Your Trading
Watch for Absorption Zones: Levels like 6112/15, where price repeatedly stalls or reverses, are goldmines for trading opportunities.
Trade with the Big Players: Absorption often happens because institutional buyers or sellers are active at these levels. By trading in the same direction, you’re aligning yourself with the “smart money.”
Manage Your Risk: Always use a stop-loss when trading absorption zones. If the level breaks, it’s a sign that the absorption has failed, and you don’t want to be on the wrong side of that move.