


ESU5/SPX - June 24th Plans, Bulls Ruthless
Bulls buy another dip

Today’s session gave us a clean look at how strong this market really is under the hood. Off the back of fresh geopolitical headlines — war chatter that would normally spark risk-off flows — ES quickly flushed down to 5993.25. The move was sharp and aggressive. But just as quickly as the selling began, buyers showed up in force. The reversal was immediate, and we rallied right back through 6070, retracing the entire flush and then some.
It was a textbook response from a market that remains resilient, even in the face of headline-driven fear. That kind of price action — a sudden flush into key levels, followed by a swift V-shaped recovery — speaks volumes about underlying demand. Buyers aren’t just stepping in passively; they’re chasing when price gives them opportunity.
But despite all that drama, the bigger picture hasn't changed. We’re still stuck inside the same multi-week range. It’s been developing quietly for a while now — a mix of failed breaks, coiling structure, and shifting initiative from both sides. And now, that range is starting to compress. The profile is tightening. Value is converging. This kind of compression tends to precede expansion. That means we’re likely not far off from a meaningful directional resolution.
The way I’m approaching this is simple: let the levels speak and trade the failed moves at the edges.
Coming into the week, I highlighted 6048/50 as immediate resistance. I mentioned I’d only be interested in shorting it if I saw trapped longs at that level — and that’s exactly what we got. Price pushed into that zone, stalled, and then flushed. That confirmed the trap setup, and we moved lower. Now that we’ve rejected and flushed off that area, I’m treating it as potential support going forward. It’s a key pivot — how we behave around it will likely dictate the next move.


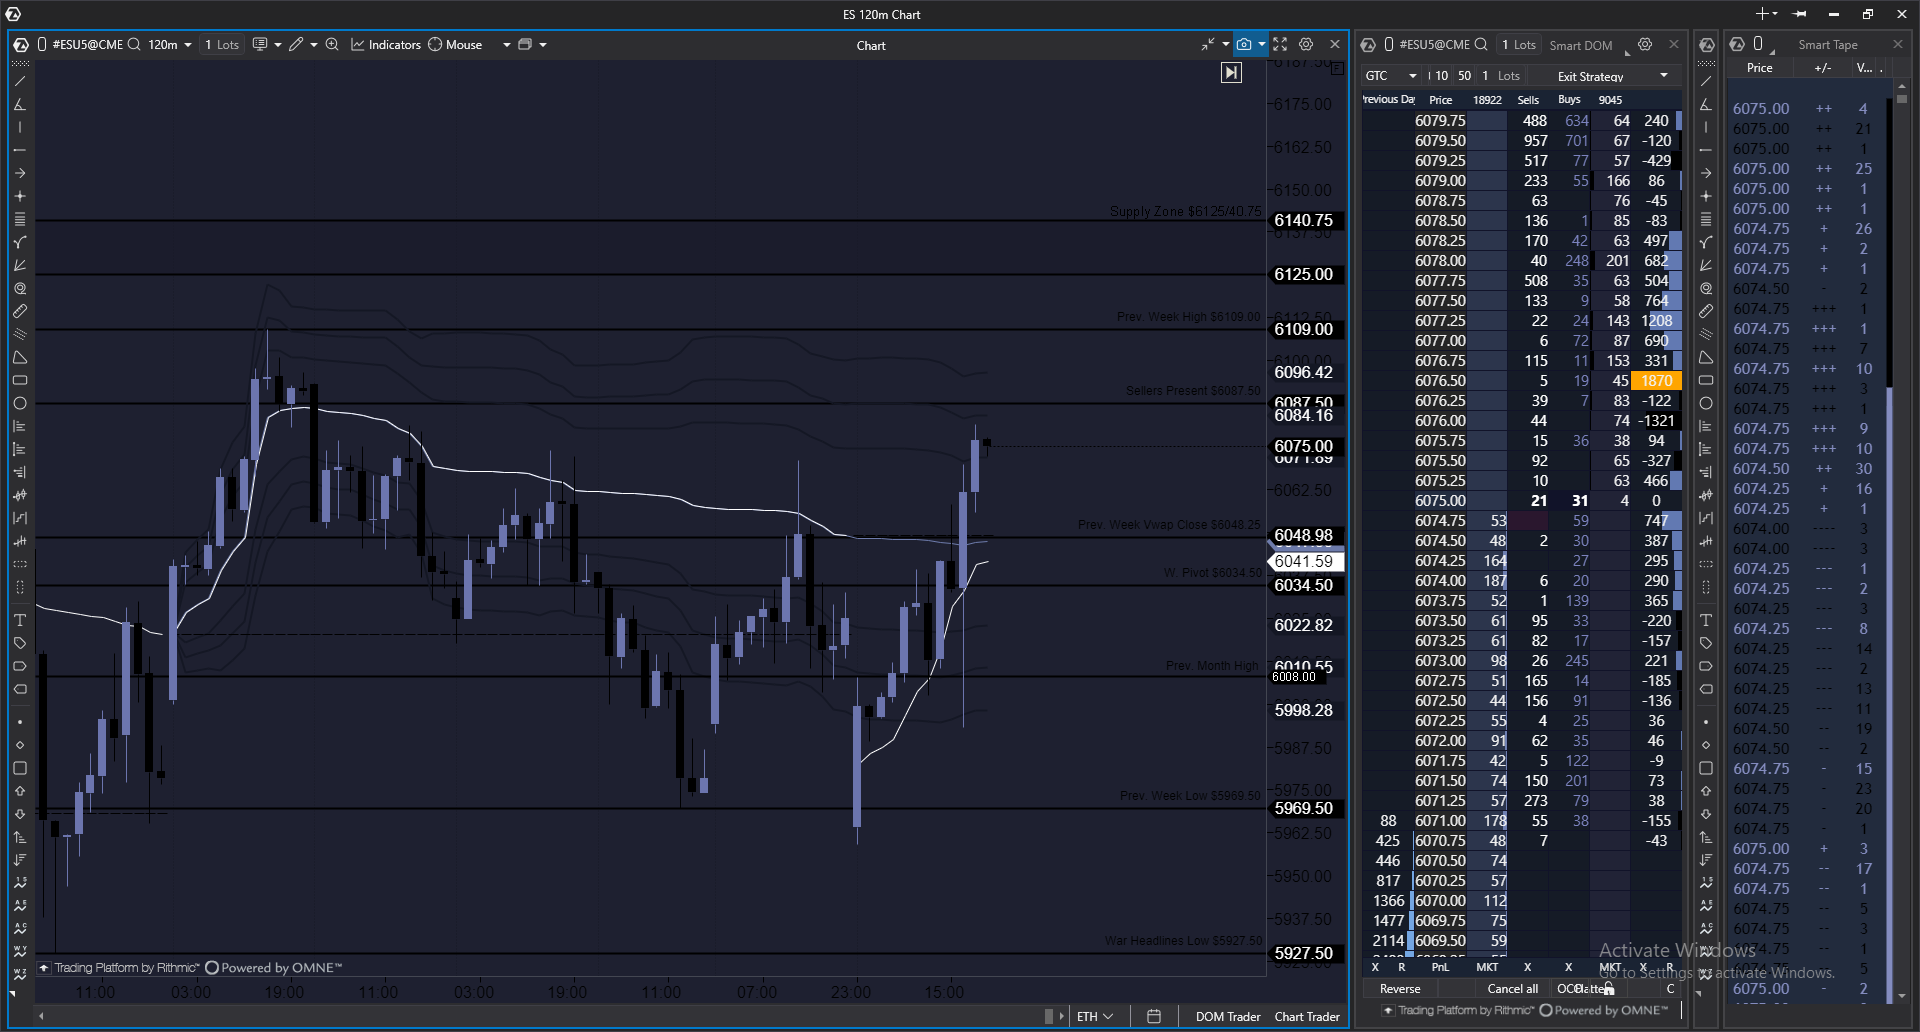
DAILY BARS/PROFILES
Game Plan: Two-Sided Traps into Key Zones
As we head into tomorrow and the rest of the week, I’m focused on two high-probability scenarios—both hinging on failed moves around well-defined zones. The setups are clean, but execution will depend on how participants behave once price interacts with these levels. I'm not interested in predictive trades here — this is about reacting to behavior at the extremes.
Scenario One: Long Setup from a Failed Breakdown at 6048–6050
We’ve got a key demand zone sitting between 6048 and 6050. I want to see a breakdown attempt that fails. Ideally, we dip into the 6030–6040 pocket — that’s where I’ll be watching for signs of seller exhaustion.
The threshold for the long idea is 6030. That’s the line in the sand. I don’t want to see price hold below there. But if we flush into that zone and can’t get traction — if sellers get aggressive, yet price doesn’t follow through — I’ll start looking for signs of absorption, delta divergence and tape confirmation to enter…..
The optimal entry will come on a sharp reclaim of 6050 with responsive buyers stepping in. Look for shifts in aggression. When that hits, I’ll get long, risking against the low of the trap.
Targets to the upside are layered:
6070: First exit.
6087: Structural resistance from last week.
6109: Big level. Previous weekly high and the likely site of a momentum test.
Scenario Two: Short Setup via Failed Breakout Above 6109
6109 is last week’s high, and right above it sits a known supply pocket: 6125 to 6140.
If we see a clean breakout above 6109, but price immediately stalls into the supply zone and starts chopping — I’ll be watching for signs of a trap. What I want to see is buyers getting aggressive up there, only to get absorbed. Look for aggressive buying that isnt move and stalling.
If we push into the 6125–6140 zone and then rotate back below 6109 — that’s my trigger. Failed breakout. Buyers trapped. Supply confirmed. I’ll hit the short on the rejection, risking against the high of the day or the upper end of the zone.
Downside targets:
6087: First check-in.
6070: More structure here. Good place to cover partials.
6050: If the unwind gets real, we could round-trip the entire move and revisit demand.
Anchoring to VWAP Structure
While these intraday zones are driving trade decisions, I’m still keeping longer-term VWAPs on the chart. They help frame context if we see a broader move develop:
YTD VWAP: 5786.75
All-Time High VWAP: 5704
Year Low VWAP: 5671.25
We’re still well above all of these, which reinforces the idea that the market hasn’t truly broken down. But if we do get an expansion move out of this range, and it’s to the downside, these levels become increasingly relevant. Especially if liquidity starts drying up and sellers gain control.
Today’s sharp reversal off a geopolitical flush was impressive — but we’re still trading inside a bigger, unresolved range. Compression is tightening. Price is coiling. Eventually, this range will break. Until it does, I’m hunting traps and trading failed conviction at the edges.
For now:
6048/50 is the short-term pivot.
6030 is the key line for any long setup — if we trade and hold below that, the idea flips.
6109–6140 remains upper resistance — and a prime area to look for failed breakouts.
- FH